Stacked column graphs (100% and Values)
In the graph below, the X and Y axes represent the same values as those in the histogram described previously but the values are stacked above each other up to a fixed total of 100%. The values in this kind of graph must relate to an Entity-based metric (speed, density, etc.).
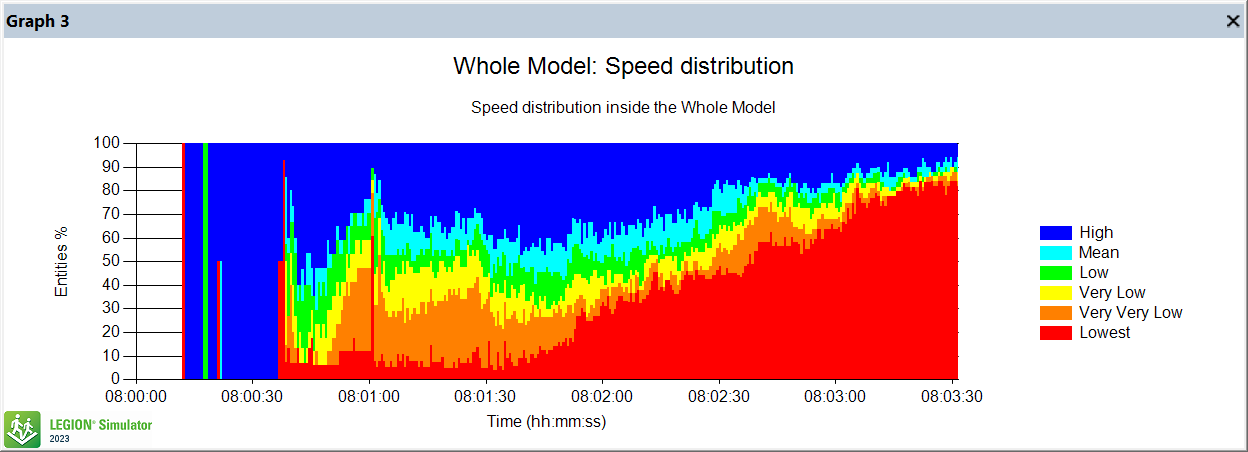
This kind of graph can also show the total number of Entities in each value range’s category as a function of time:
